13 lead generation KPIs to track for better conversions
Track and improve the lead gen metrics that matter: conversion rate, CAC, MQLs, CLV, and total number of leads. This guide breaks it all down.
A running coach wouldn’t plan and tweak their top star’s diet and training based on gut feelings.
They’d track performance, such as the runner’s sprint time, and observe how it changes with various inputs, like sleeping for nine hours instead of seven.
Marketers should treat lead generation with the same attentiveness that a coach treats a track star. Monitoring KPIs, from CAC to conversion rates, helps you spot weaknesses, test new approaches, and gradually optimize your lead generation process.
What the best outbound teams actually monitor
While low-performing teams waste their time obsessing over vanity metrics, the top outbound teams track KPIs that help them make smart decisions about their lead generation strategy. This constant engagement with what’s actually going on helps them stay ahead of the competition.
Skip vanity, track velocity
KPIs are your company’s most telling metrics. They show the reality—even if it’s harsh—of the performance of your outbound lead generation channels, campaigns, and processes.
Avoid tracking vanity metrics that make you feel good and little else. Instead, monitor metrics that help you identify weak points and make tangible improvements.
For example, a sales rep shouldn’t obsess over something like the number of likes and impressions on their recent LinkedIn post. Instead, they should look at whether or not that post led to any sales conversations with decision-makers.
Whichever KPIs you choose to track, the key is to make sure your sales and marketing team agree on them, their definition, and the formula for calculating them.
Otherwise, you’ll increase the likelihood of miscommunications. Perhaps the most classic case is when the marketing team’s definition of a qualified lead differs from the sales team’s definition, resulting in frustrated sales reps meeting with prospects who are unlikely to close.
The four buckets that matter
Outbound teams don’t need to spread themselves thin across hundreds of metrics. They can gain deep insight into their sales performance by focusing on four main buckets of KPIs.
Here’s an overview of the most crucial KPI categories:
Quantity: Total number of leads generated, broken down by lead source (e.g., cold email, LinkedIn, webinars, social media)
Quality: How many leads become marketing-qualified leads (MQLs), sales-qualified leads (SQLs) and MQLs paying customers
Cost: Cost per lead, customer acquisition cost (CAC), and return on investment (ROI)
Conversion: How many convert at each stage of the funnel
13 KPIs that predict pipeline (not just activity)
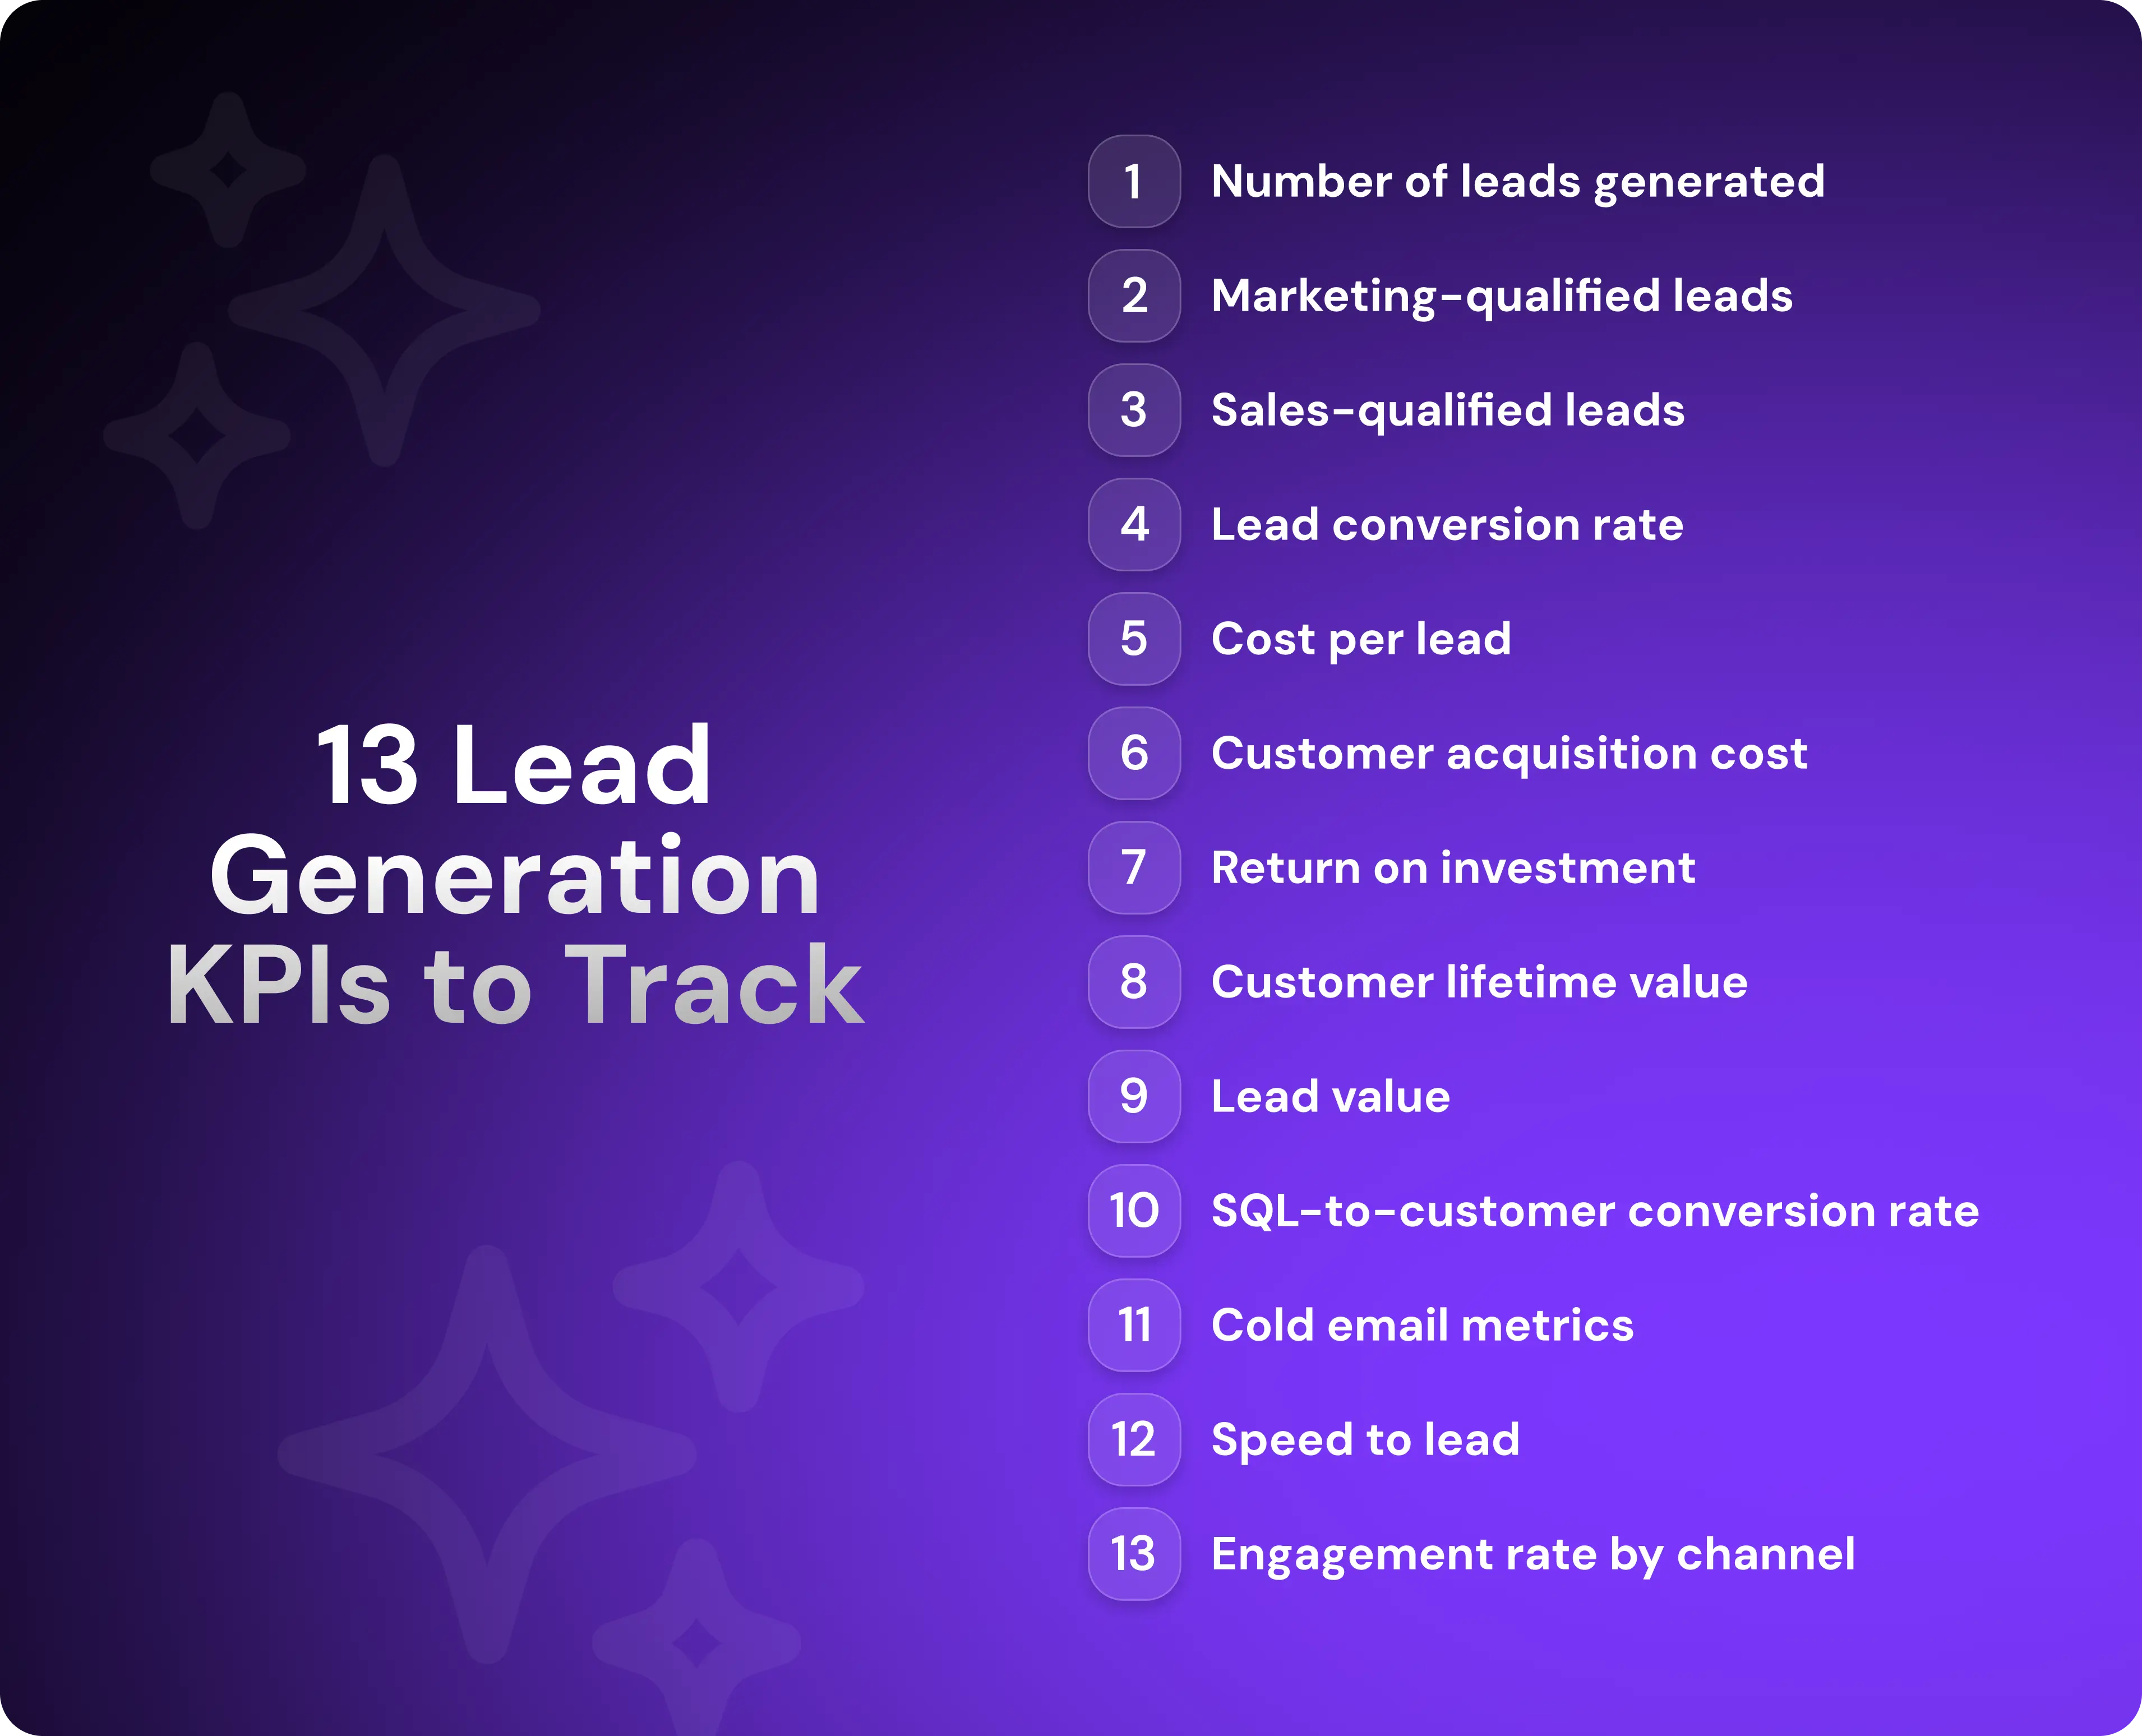
Tracking activities like dials made or emails sent is informative, but not as revealing as metrics that show the results of these activities and are better predictors of pipeline, such as MQLs generated and lead conversion rate.
1. Number of leads generated
Every outbound sales team should know how many leads their outbound tactics are actually generating. Most companies calculate this on a monthly, quarterly, and annual basis.
To determine the number of leads generated, simply count all leads generated from your outbound channels.
Depending on your outbound lead gen strategy, these channels might be:
Cold email
Cold calling
Social media outreach
Industry events
Networking activities
Referral programs
Account-based marketing
2. Marketing-qualified leads (MQLs)
MQLs are leads that the marketing team has qualified. They have shown interest in your solution and are now ready for nurturing.
For example, a lead who fits your ICP and downloaded an ebook about your product might be deemed an MQL, whereas a lead sitting in your prospecting list who hasn’t shown any buying signals would not have that status.
Of course, the exact criteria that distinguish an MQL from a general lead depend on your team’s lead qualification and scoring system.
Tracking MQLs is important for three main reasons:
Sales can identify and focus on high-quality leads, thus boosting sales productivity.
Marketing can measure the effectiveness of email marketing, landing pages, webinars, and other lead generation efforts.
Revenue teams can identify which channels produce the best leads and double down.
3. Sales-qualified leads (SQLs)
SQLs are leads that the sales team has qualified—they have shown definite interest in your product and are very likely to buy.
Your MQL-to-SQL conversion rate tells you how effectively your sales team is turning MQLs into SQLs. It helps you answer the question "How skillfully are sales reps turning these warm leads into prospects?”
If this rate is low, it’s usually a sign of one of three main problems with the later stages of your lead generation process:
The criteria for MQL is too relaxed or inaccurate.
Sales reps are struggling to generate serious interest in warm leads.
Your follow-up process with MQLs is ineffective.
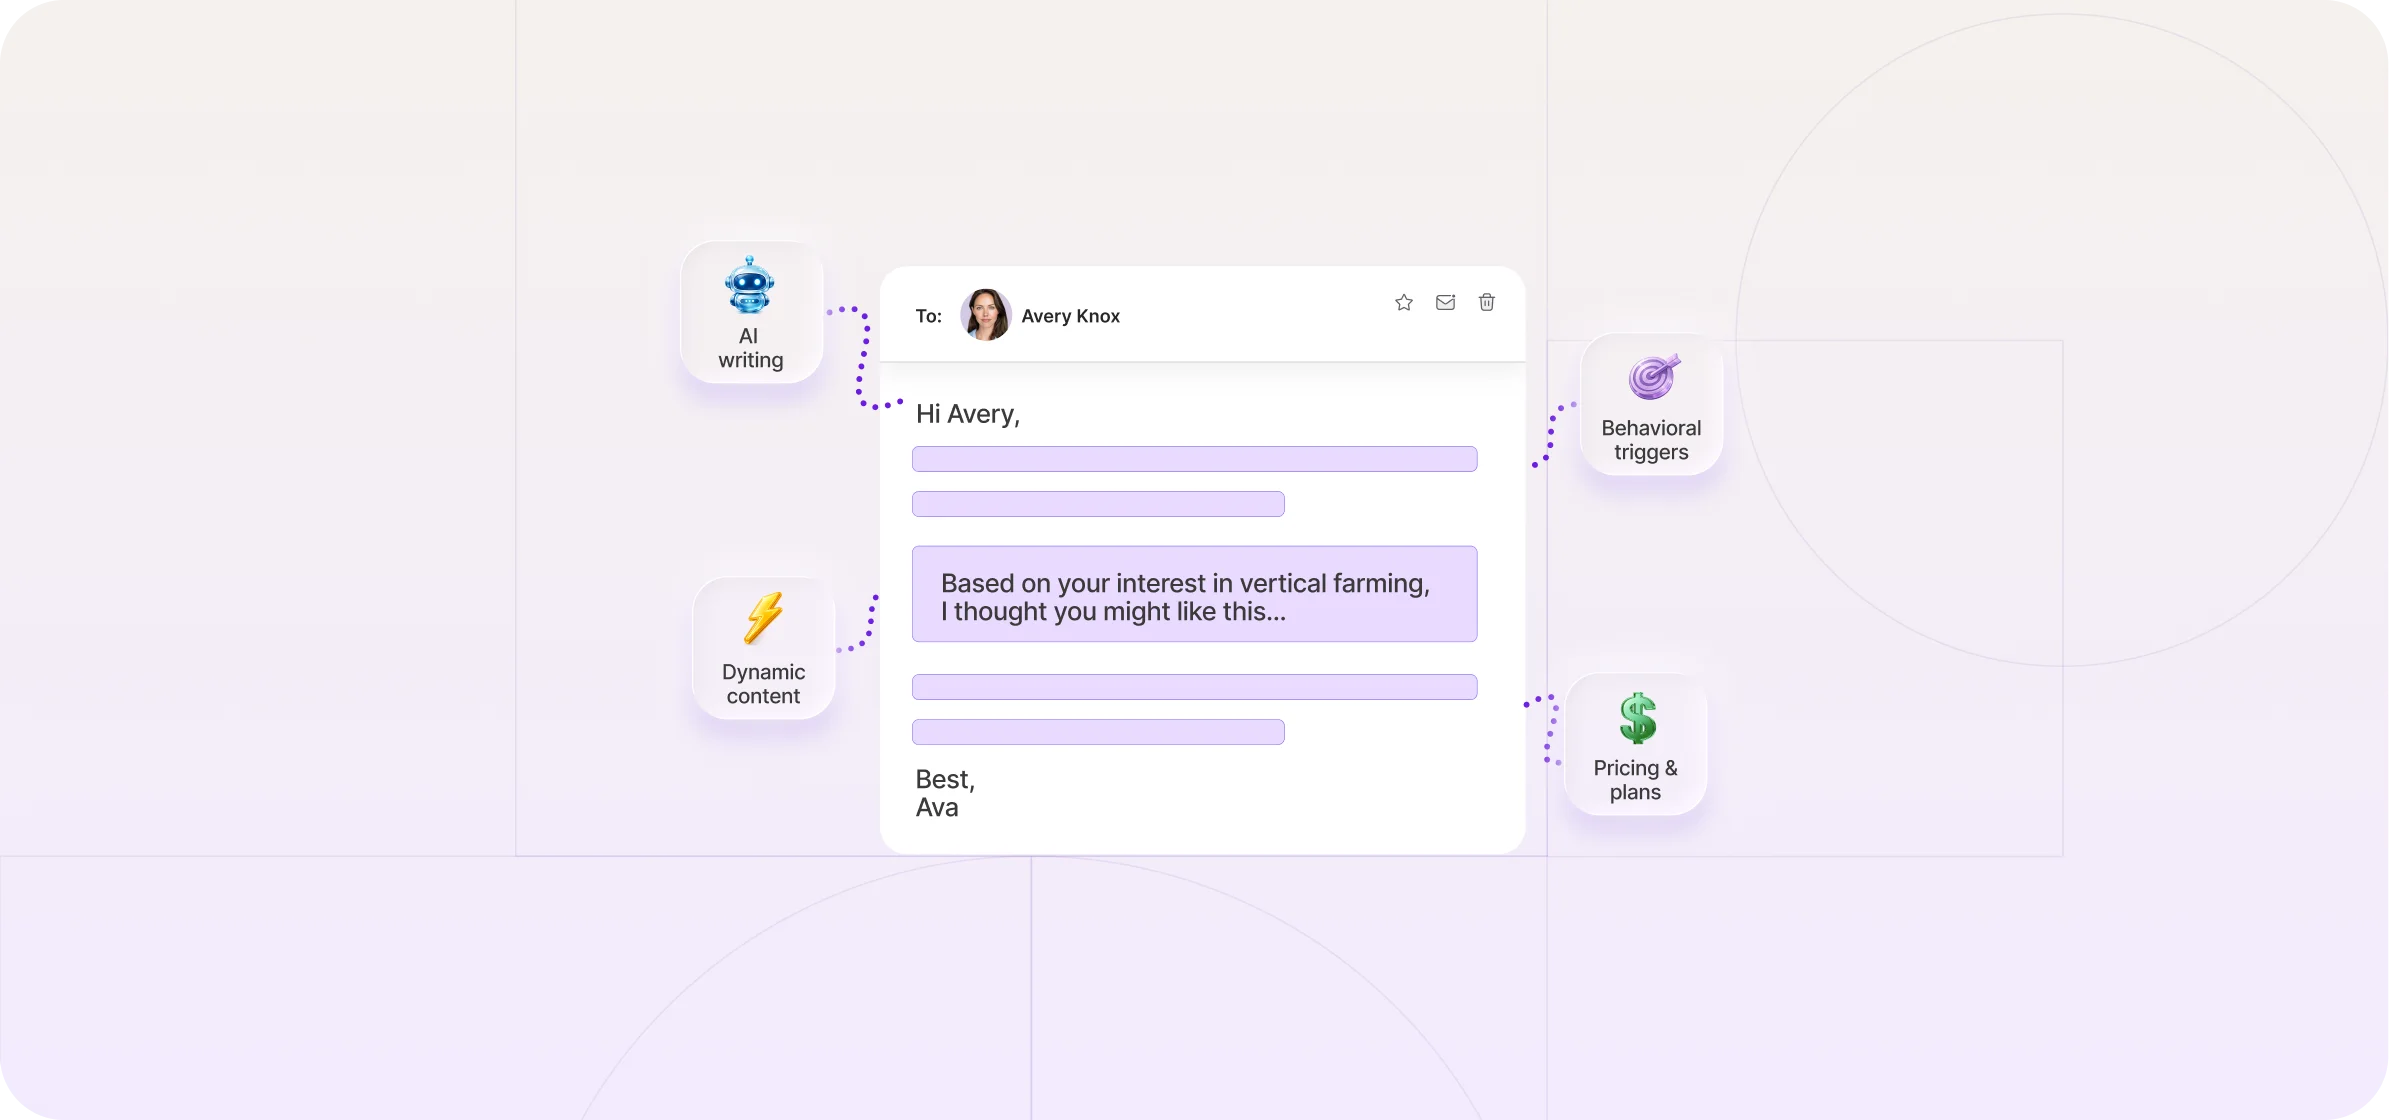
Automation tools like Ava can tighten the follow-up process and improve your MQL-to-SQL conversion rate. Ava automatically sends personalized emails to MQLs, so no leads fall through the cracks and sales meetings are booked on autopilot.
4. Lead conversion rate
Lead conversion rate is the percentage of leads that turn into paying customers.
This KPI helps your business measure the effectiveness of your lead follow-up system and sales process.
Here’s how to calculate lead conversion rate:
Lead Conversion Rate = (Number of Conversions ÷ Total Number of Leads) × 100
For example, say your sales team generated 1000 leads in 2025 and closed 100 of them. That’s a lead conversion rate of 10%. Not bad.
This KPI benchmark is usually around 10–15%, but there is variance between industries.
If your lead conversion rate is below your industry benchmark, you can improve it by refining sales messaging, improving ICP targeting, and injecting more personalization into your outreach.
KPIs that show efficiency
Measuring outcomes is important. Outcome KPIs help you gauge the health of your overall lead gen system. But you also need efficiency KPIs like cost per lead (CPL) and customer acquisition cost (CAC). These point to the specific areas where there’s scope for improvement.
5. Cost per lead (CPL)
Sometimes a lead just isn't worth the cost.
CPL is the budget-conscious founders’ friend. It helps you identify areas where you’re spending too much on lead generation, stealing resources from other areas.
Here’s how to calculate cost per lead:
CPL = Total Marketing Spend ÷ Number of Leads Generated
This KPI on its own is helpful, but it becomes more useful when you start finding the CPL of different channels and campaigns.
For example, you might compare CPL for email vs. LinkedIn vs. content marketing. In the analysis, perhaps you discover that the CPL for LinkedIn outreach is extraordinarily high, and the leads aren’t of high enough quality to justify that expense. You can then divert those funds into another less expensive channel.
If you have a high CPL, there are two common ways to reduce it:
Improve your ICP and behavioral targeting, focusing on leads who are most likely to buy.
Implement automation for prospecting, outreach, and scoring, thereby cutting the time your team spends on manual tasks.
AI BDRs can dramatically reduce CPL. Chain of Events, for example, used Artisan to replace 5 full-time BDRs. In six months, they sourced over $700k in annual recurring revenue (ARR). That’s 20 times their annual investment in the tool.
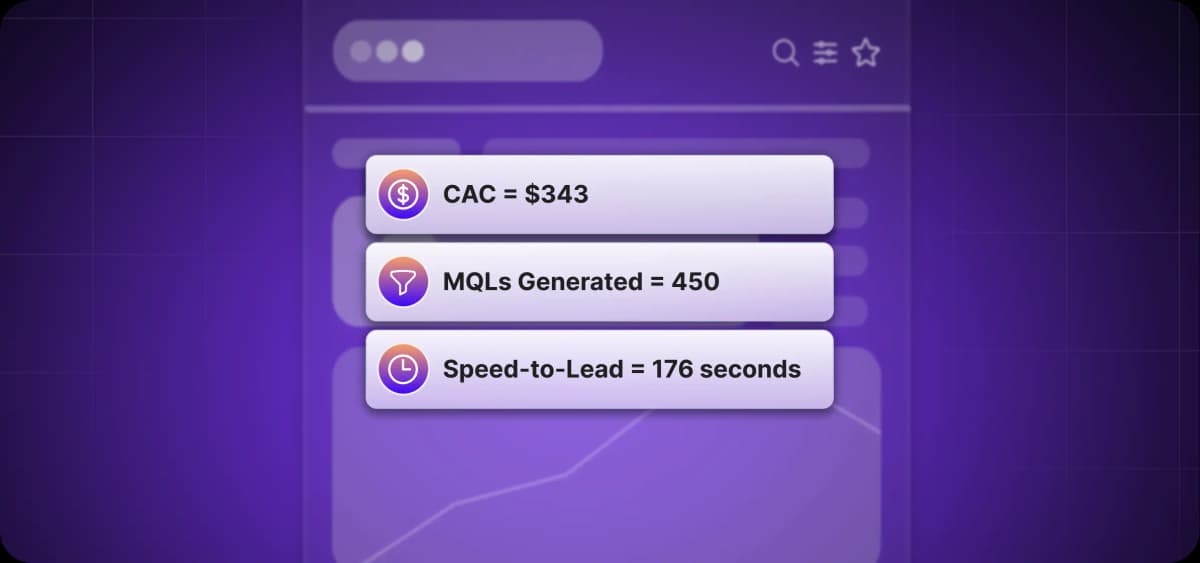
6. Customer acquisition cost (CAC)
CAC helps you determine how much money, on average, it takes to generate a new buyer. In other words, it measures the cost-effectiveness of your sales strategy.
Here’s the formula to calculate CAC:
CAC = Total Sales and Marketing Spend ÷ Total New Customers
Though similar to CPL, CAC is a broader KPI. The cost part of the equation extends past marketing budget to include staff salaries, tech spend, and anything else involved in generating a paying customer.
If your CAC is high, here are the two best strategies to lower it:
Automate lead generation with AI tools to bring in more leads without increasing headcount.
Conduct more targeted outreach and stricter lead qualification. This reduces wasted budget and time on low-quality leads.
7. Return on investment (ROI)
ROI connects CPL and CAC to lead value and revenue.
If your CAC and CPL are high, but the ROI of your outbound efforts is also high, there’s not much to fret over. Yes, work to reduce those costs—but the cost is producing something of immense value for your business.
Here’s the formula to calculate the ROI of your outbound lead generation system:
ROI = (Total Revenue – Total Sales and Marketing Cost) ÷ Total Cost x 100
Cost includes salaries, investments, ad spending, and tech spend. How you arrive at revenue depends on your business model, but one effective way is to find your average customer lifetime value (CLV) and multiply it by the number of new customers over a set period.
To illustrate, let’s say you invested $100,000 into outbound lead generation in 2025 and converted 100 new customers. Your CLV is $3,000. So the total revenue is $300,000. Deducting costs from revenue, you’re left with an ROI of 200%.
KPIs that show lead quality
Lead quality is more important than lead quantity. KPIs like CLV and SQL-to-customer rate show you if your lead generation processes are generating high-value prospects with a good chance of converting into paying customers.
8. Customer lifetime value (CLV)
CLV predicts the total revenue your business can expect from a single customer over the entire relationship you have with them.
Tracking CLV helps you spot opportunities to improve your customer retention strategy and refine your lead scoring process, as one of the major reasons for low CLV is letting in too many poor-fit customers who churn or buy only once.
Here’s how to calculate customer lifetime value:
CLV = (Average Purchase Value) x (Average Purchase Frequency) x (Average Customer Lifespan)
Since B2B brands typically have fewer customers than B2C brands, and since the sales cycles are longer (which means higher CAC), they should aim to achieve a high CLV.
If your CAC is higher than your CLV, that spells trouble. It means you’re spending more to acquire customers than you’re earning from them in new revenue.
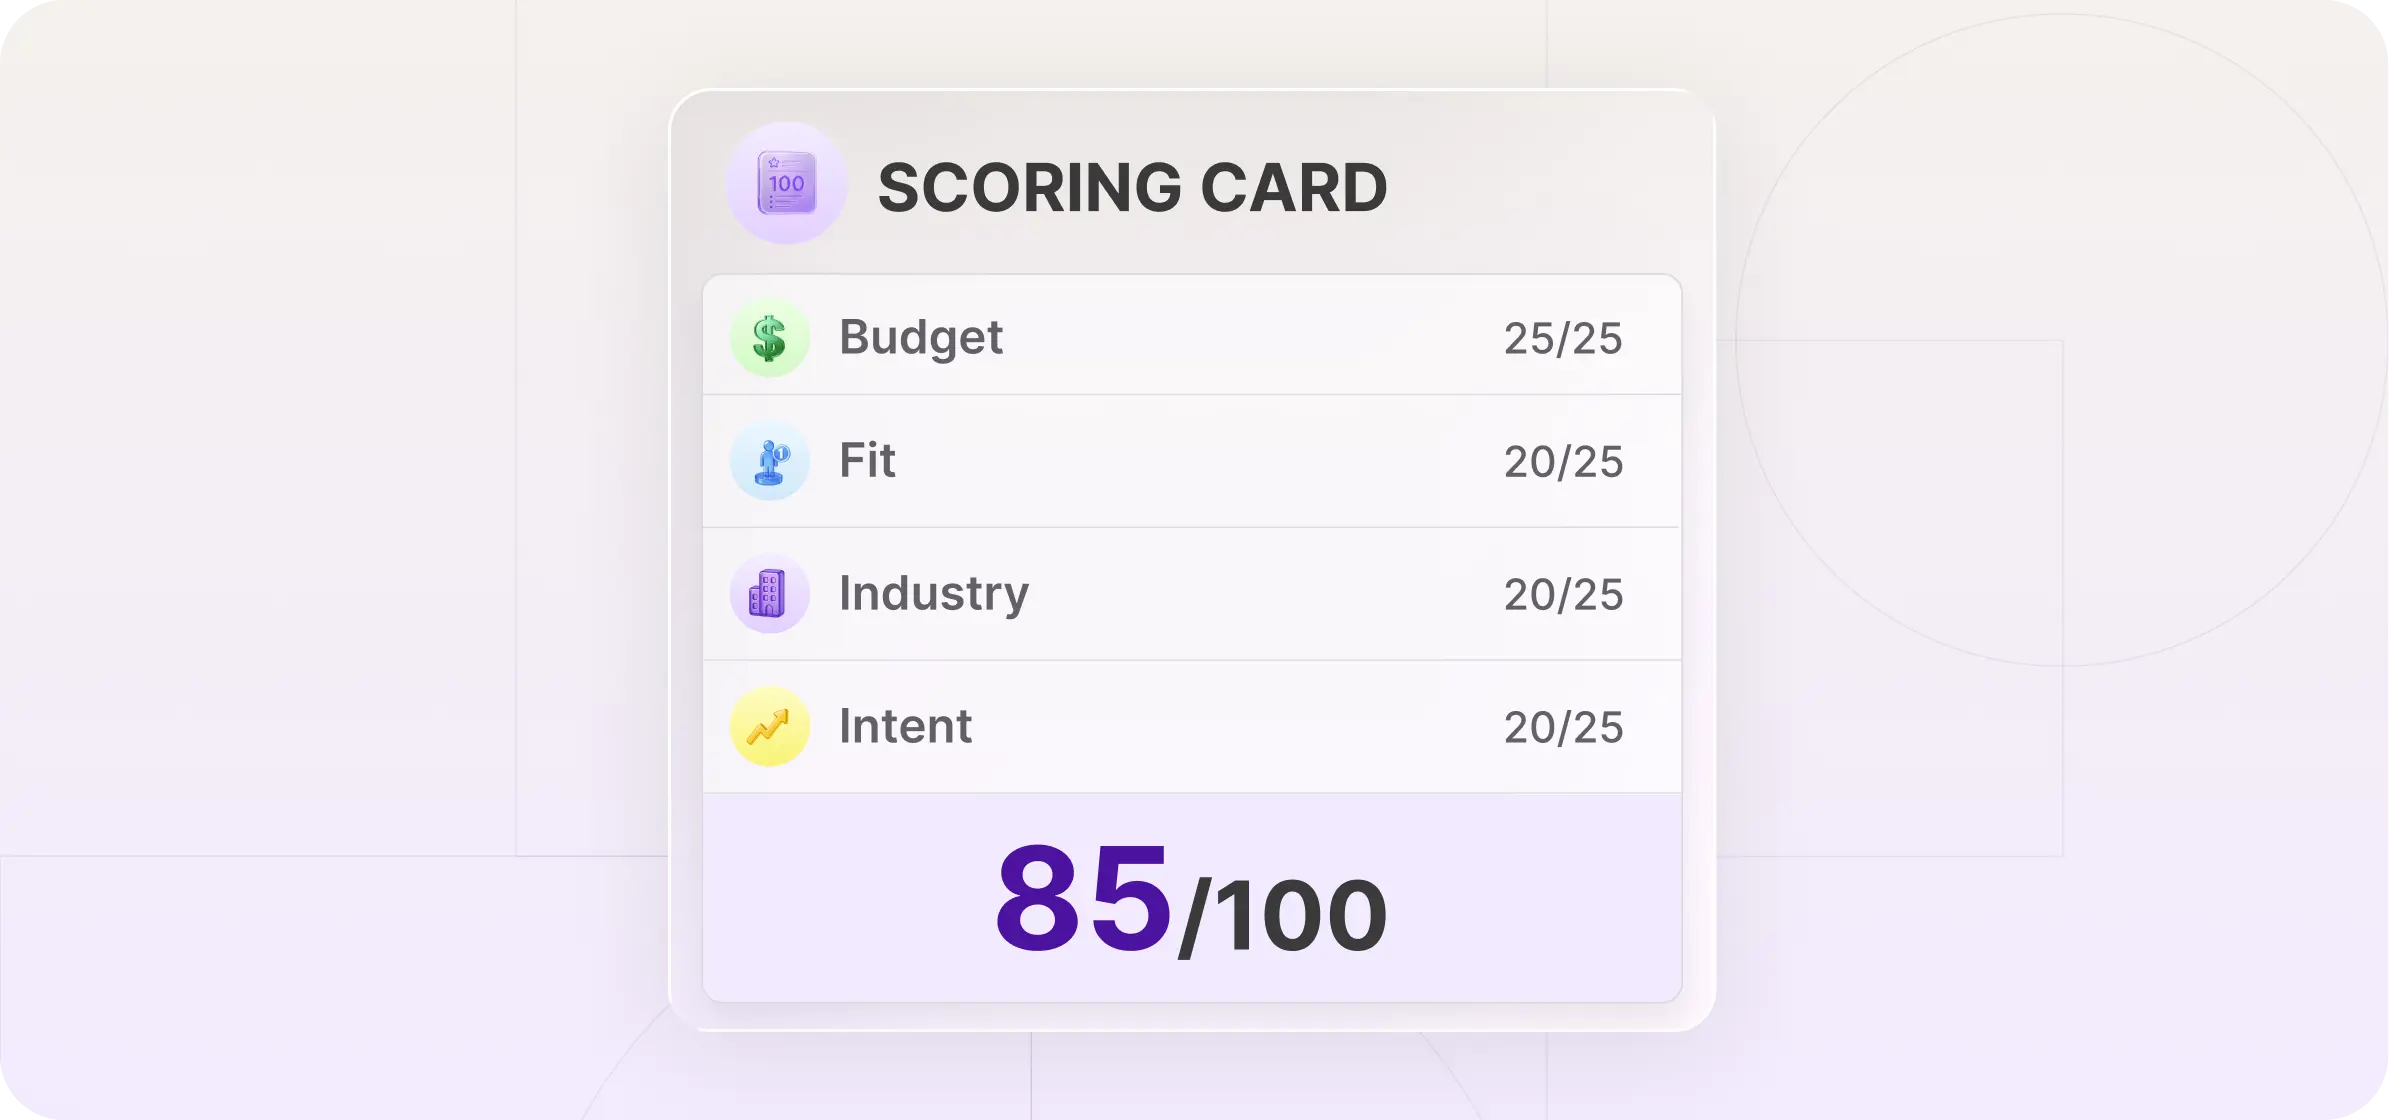
9. Lead value and lead scoring
To help your sales team prioritize leads, assign a dollar value to different categories of leads based on past conversion rates and historical sales data. Reps can then focus more of their limited time on the leads worth more in predicted revenue.
In addition, set up a lead scoring system that scores leads based on how well they match your ICP and how much they’re engaging with your brand. Take into account online behavior like page visits, firmographics like company size, and even technology use.
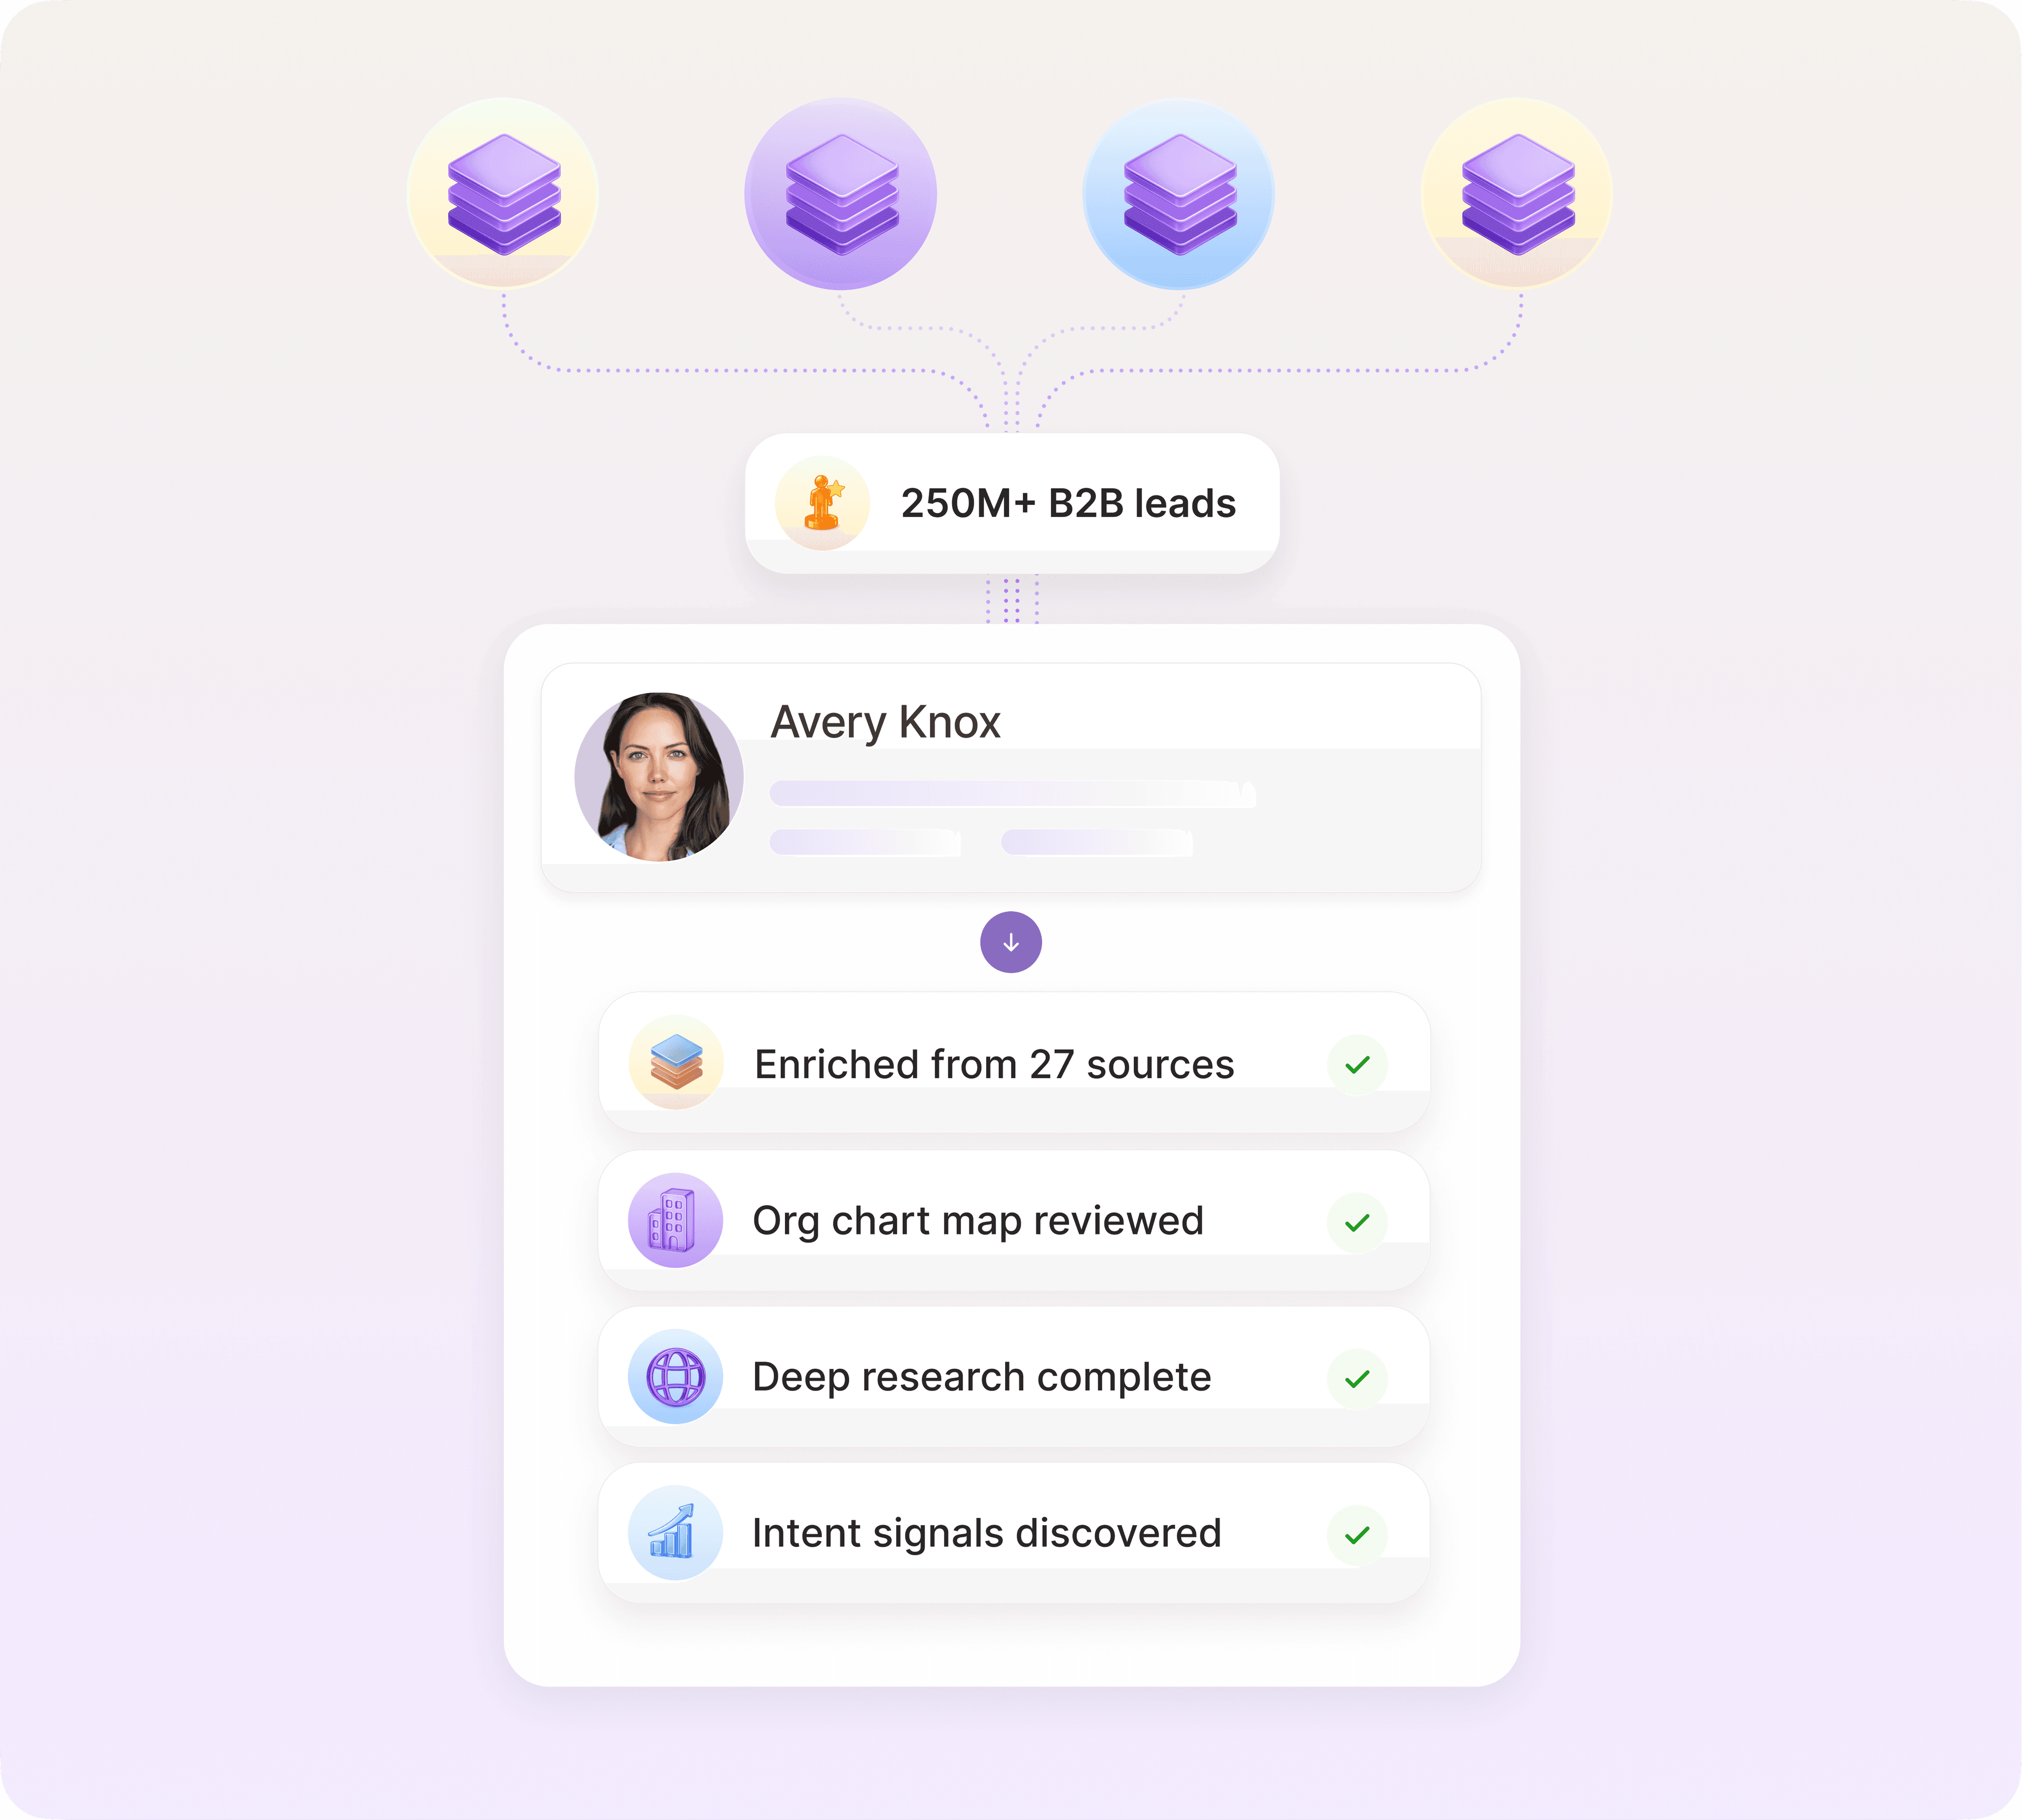
Manually setting up scoring models and constantly collecting the lead data that power them is time-consuming, technically involved work. That’s why teams are increasingly turning to outbound sales automation tools like Artisan. Ava, an autonomous AI BDR that sits at the core of the platform, will find high-quality leads, enrich their profiles with fresh data, and score them automatically, so you don’t have to.
10. SQL-to-customer conversion rate
Your SQL-to-customer conversion rate tells you how many SQLs actually close.
This makes it an excellent metric for gaining insight into the effectiveness of every part of your sales process after lead qualification, from initial presentations to the contract review.
Here’s how to calculate SQL-to-customer conversions:
SQL-to-Customer Conversion Rate = (Total Number of Won Deals ÷ Total Number of SQLs Generated) x 100
If you’re seeing low SQL-to-customer conversions, something is going wrong during your post-SQL sales process:
Here are the best ways to optimize this KPI:
Improve sales handoff between BDRs/marketing and account executives (AEs).
Respond to SQLs more quickly.
Personalize demos, sales decks, and proposals in greater depth.
Test new ways of nurturing leads after they become SQLs.
KPIs that show engagement (overall funnel health)
Measuring lead engagement KPIs, like email reply rates, helps you understand which copy, campaigns, and marketing assets are resonating and which are falling flat.
11. Email open, CTR, and reply rates
Tracking email metrics helps you understand what’s working and not working in your email outreach strategy. For example, low email open rates are often a sign of an ineffective subject line.
Here are the major email KPIs to monitor:
Open rates: Percentage of recipients who open your email
Click-through rates (CTR): Percentage of recipients who click on a link in your email (like a link to a demo recording or a digital calendar)
Reply rates: Percentage of recipients who reply to your email
Conversion rates: Percentage of recipients who move onto the next stage of the sales process (typically, a discovery meeting)
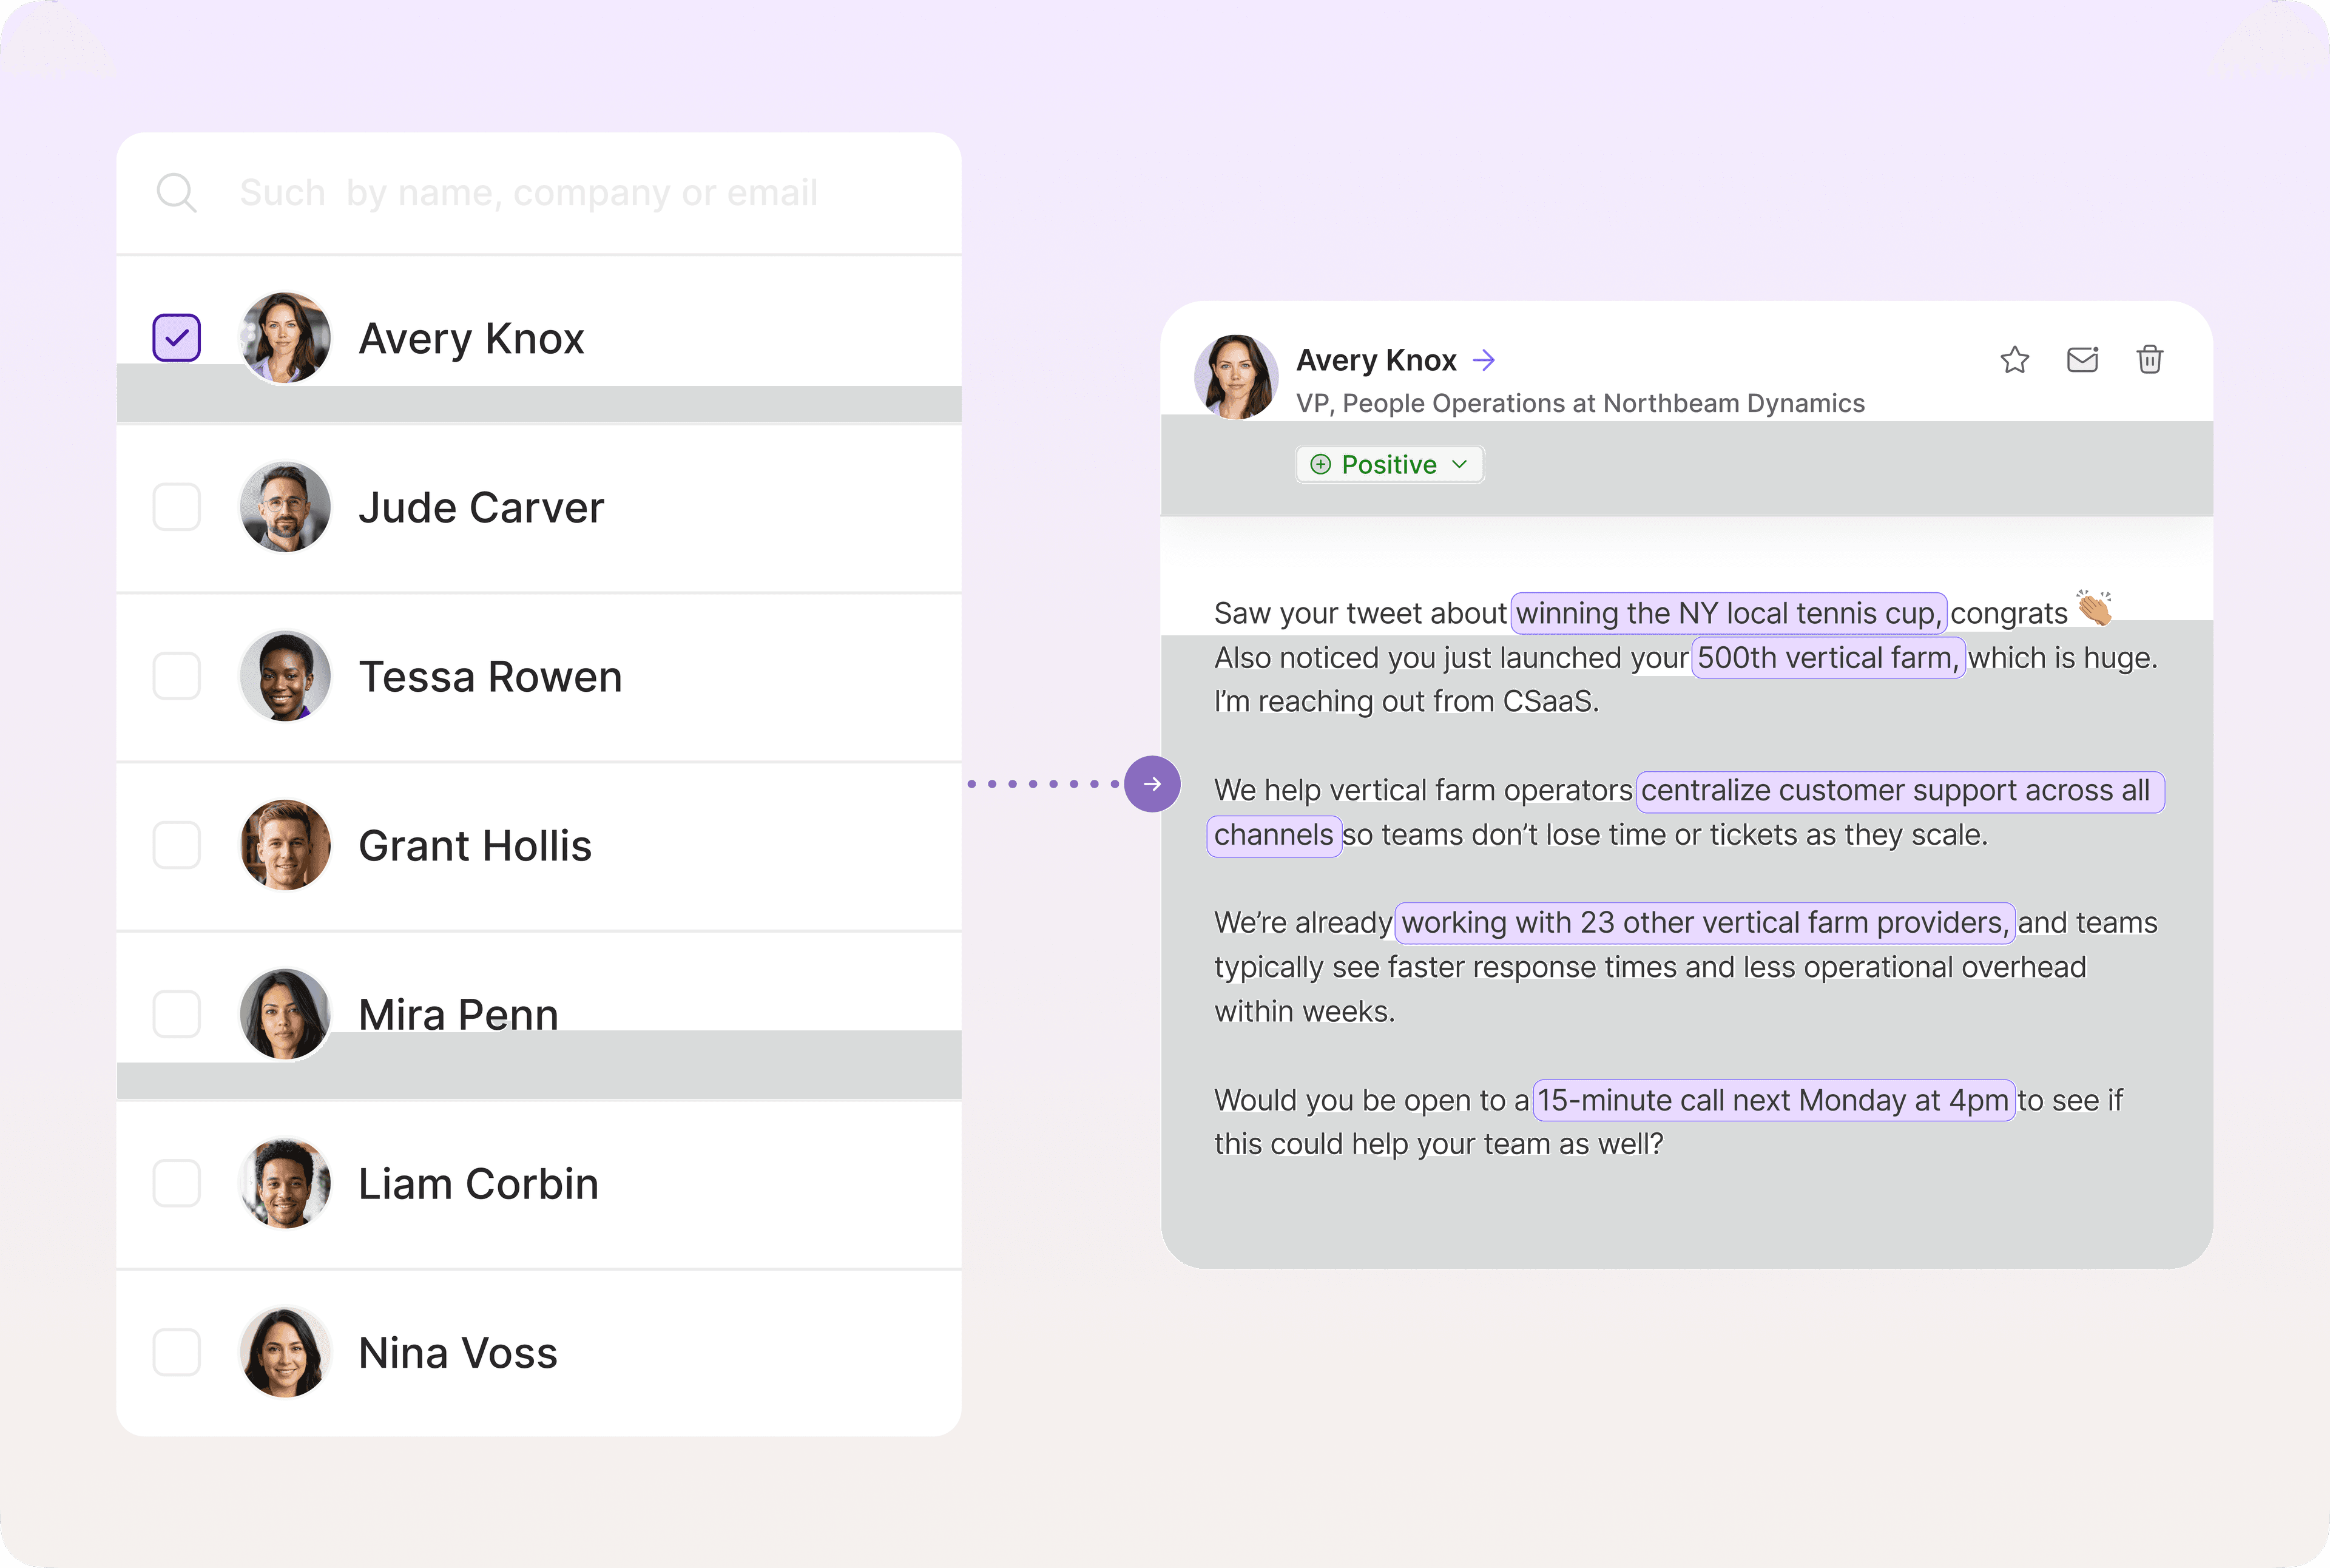
In many cases, the fastest way to immediately boost all four metrics is to improve outreach personalization.
Here are three proven ways of tailoring emails to recipients:
Mention a relevant pain point in the subject line.
Show them you know them in the opener—for example, “I noticed you were recently promoted to Head of Sales…”
Share an aspect of your value proposition that will help them do their job better.
Personalization at scale is practically impossible for teams that are sending outreach at scale. Artisan uses the most advanced data scraping and AI personalization tech available, which means your reps can send hundreds or even thousands of tailored emails every week without any human input.
12. Speed to lead (follow-up time)
Speed to lead, also known as follow-up time, measures the average amount of time it takes a salesperson to interact with a lead who has expressed interest in your product or service.
Slow lead-to-speed can result in a lot of "Who are you again?” questions. It's not uncommon for leads to forget about the web form they submitted a few days ago or the email they replied to last month.
In fact, just a five-minute delay can be the difference between conversion and getting ghosted. A study by Lead Response Management discovered that if the response time stretched from 5 to 30 minutes, there was a decrease of 21 times in the chances of qualifying the lead.
Improving speed-to-lead, therefore, can boost your conversion rates significantly. Reps need to strike when your product is still fresh in the leads’ minds.
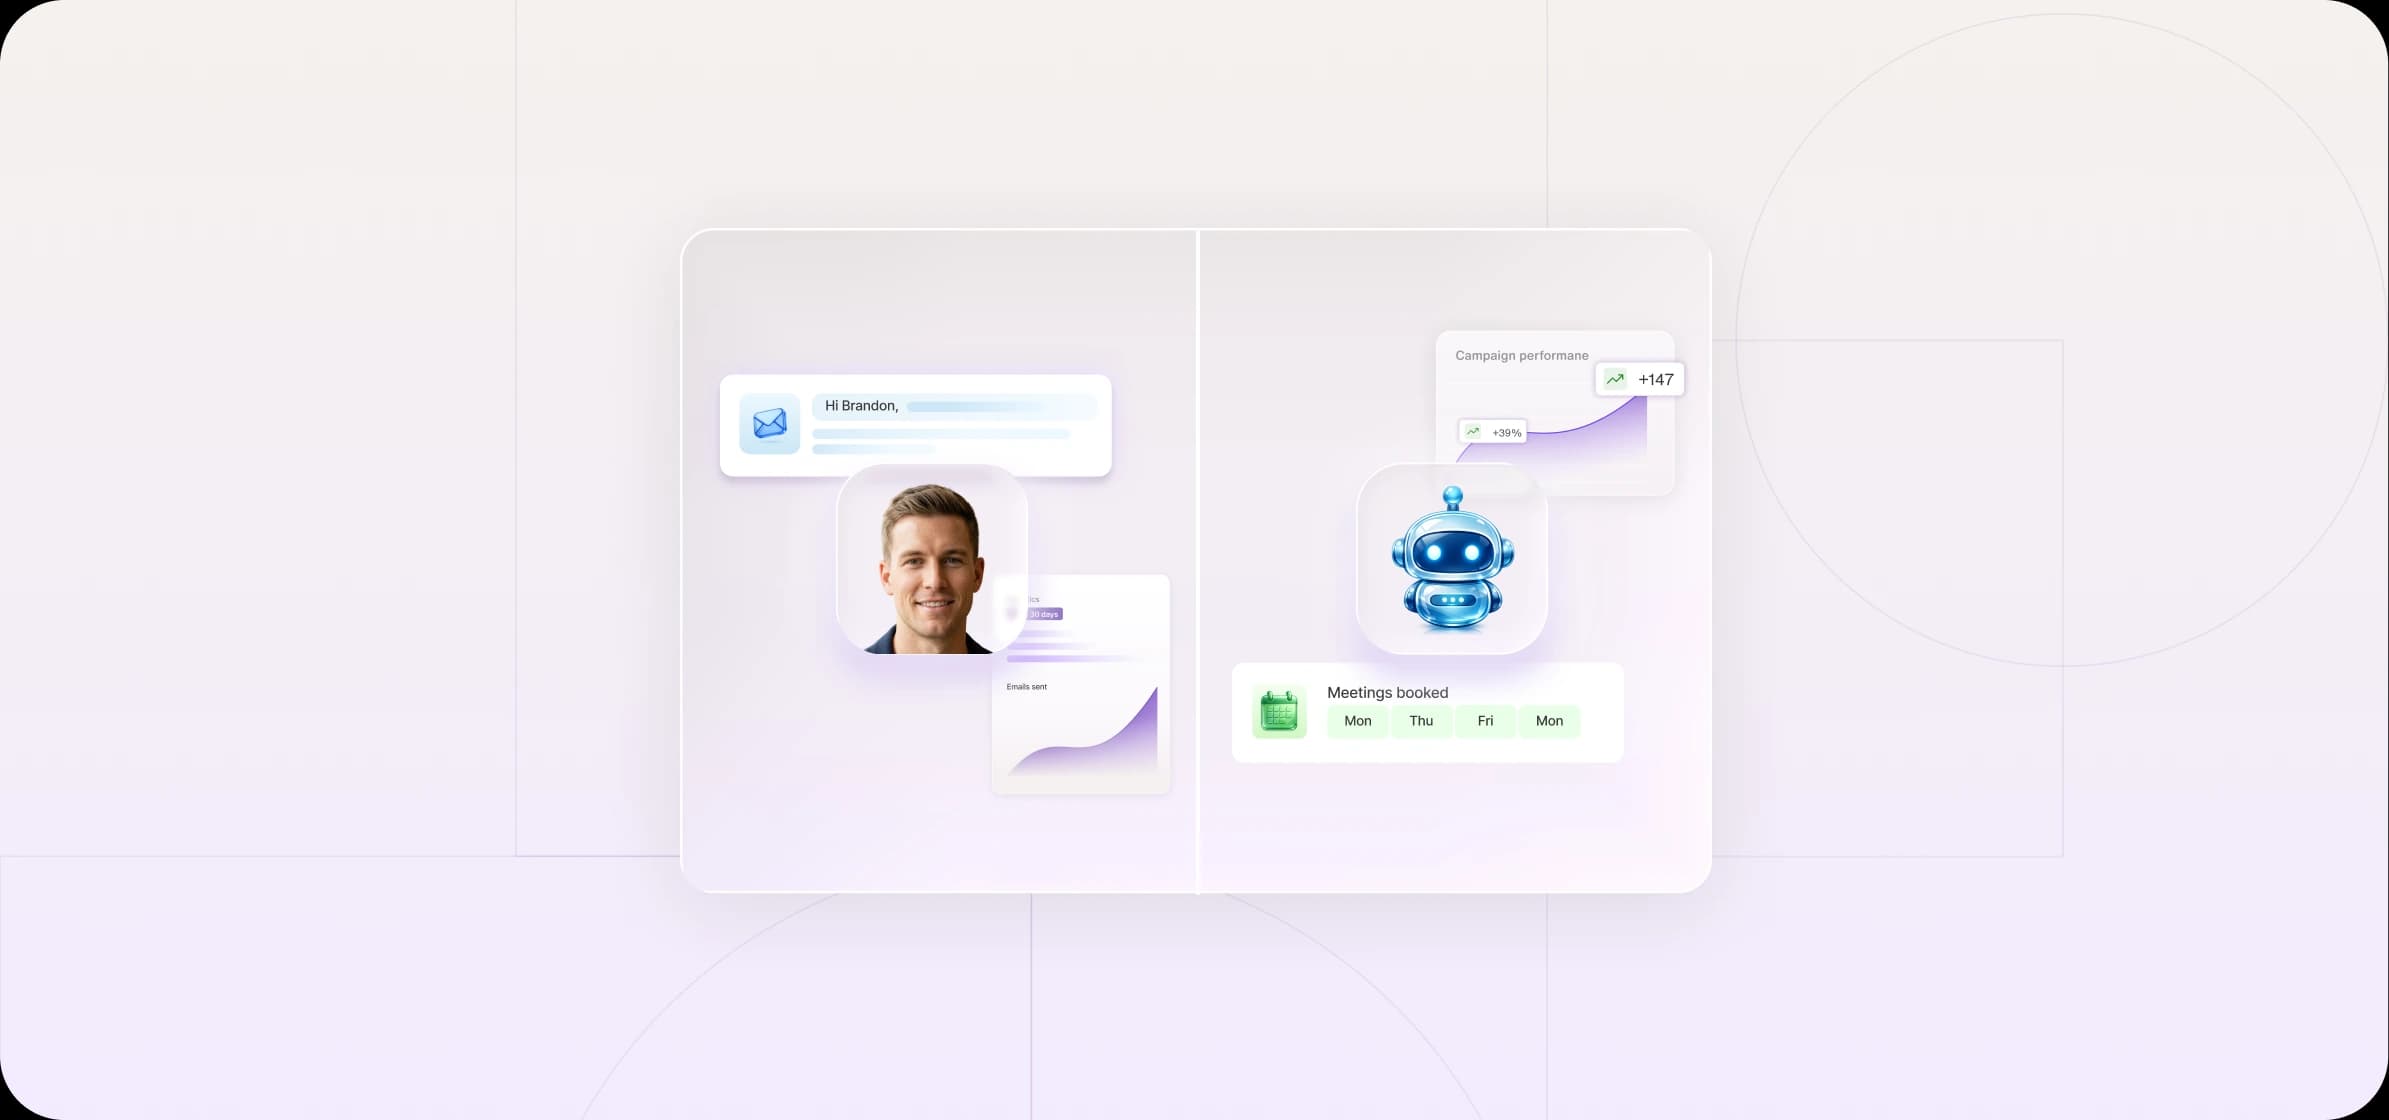
Artisan’s outreach engine, powered by AI BDR like Ava, auto-triggers emails in real-time, pushing speed to lead as close to zero as possible and boosting conversion rates as a result.

13. Engagement rate by channel
Which channels are producing the highest quality interactions with potential customers?
The answer to this question will help you identify channels that aren’t working. You can then test different ways of improving engagement.
Compare your engagement rates of the following sales channels:
LinkedIn outreach
Email outreach
Webinars
Cold calls
Online advertising
Networking events (trade shows, conferences, etc.)
If you see any outliers—or if your metrics consistently fall below industry benchmarks—then you should test new content strategies. Barring technical issues, such as blacklisted email domains and restricted social media accounts, content that doesn’t drive hook recipients is usually to blame for low engagement.
How to track these KPIs without losing your mind
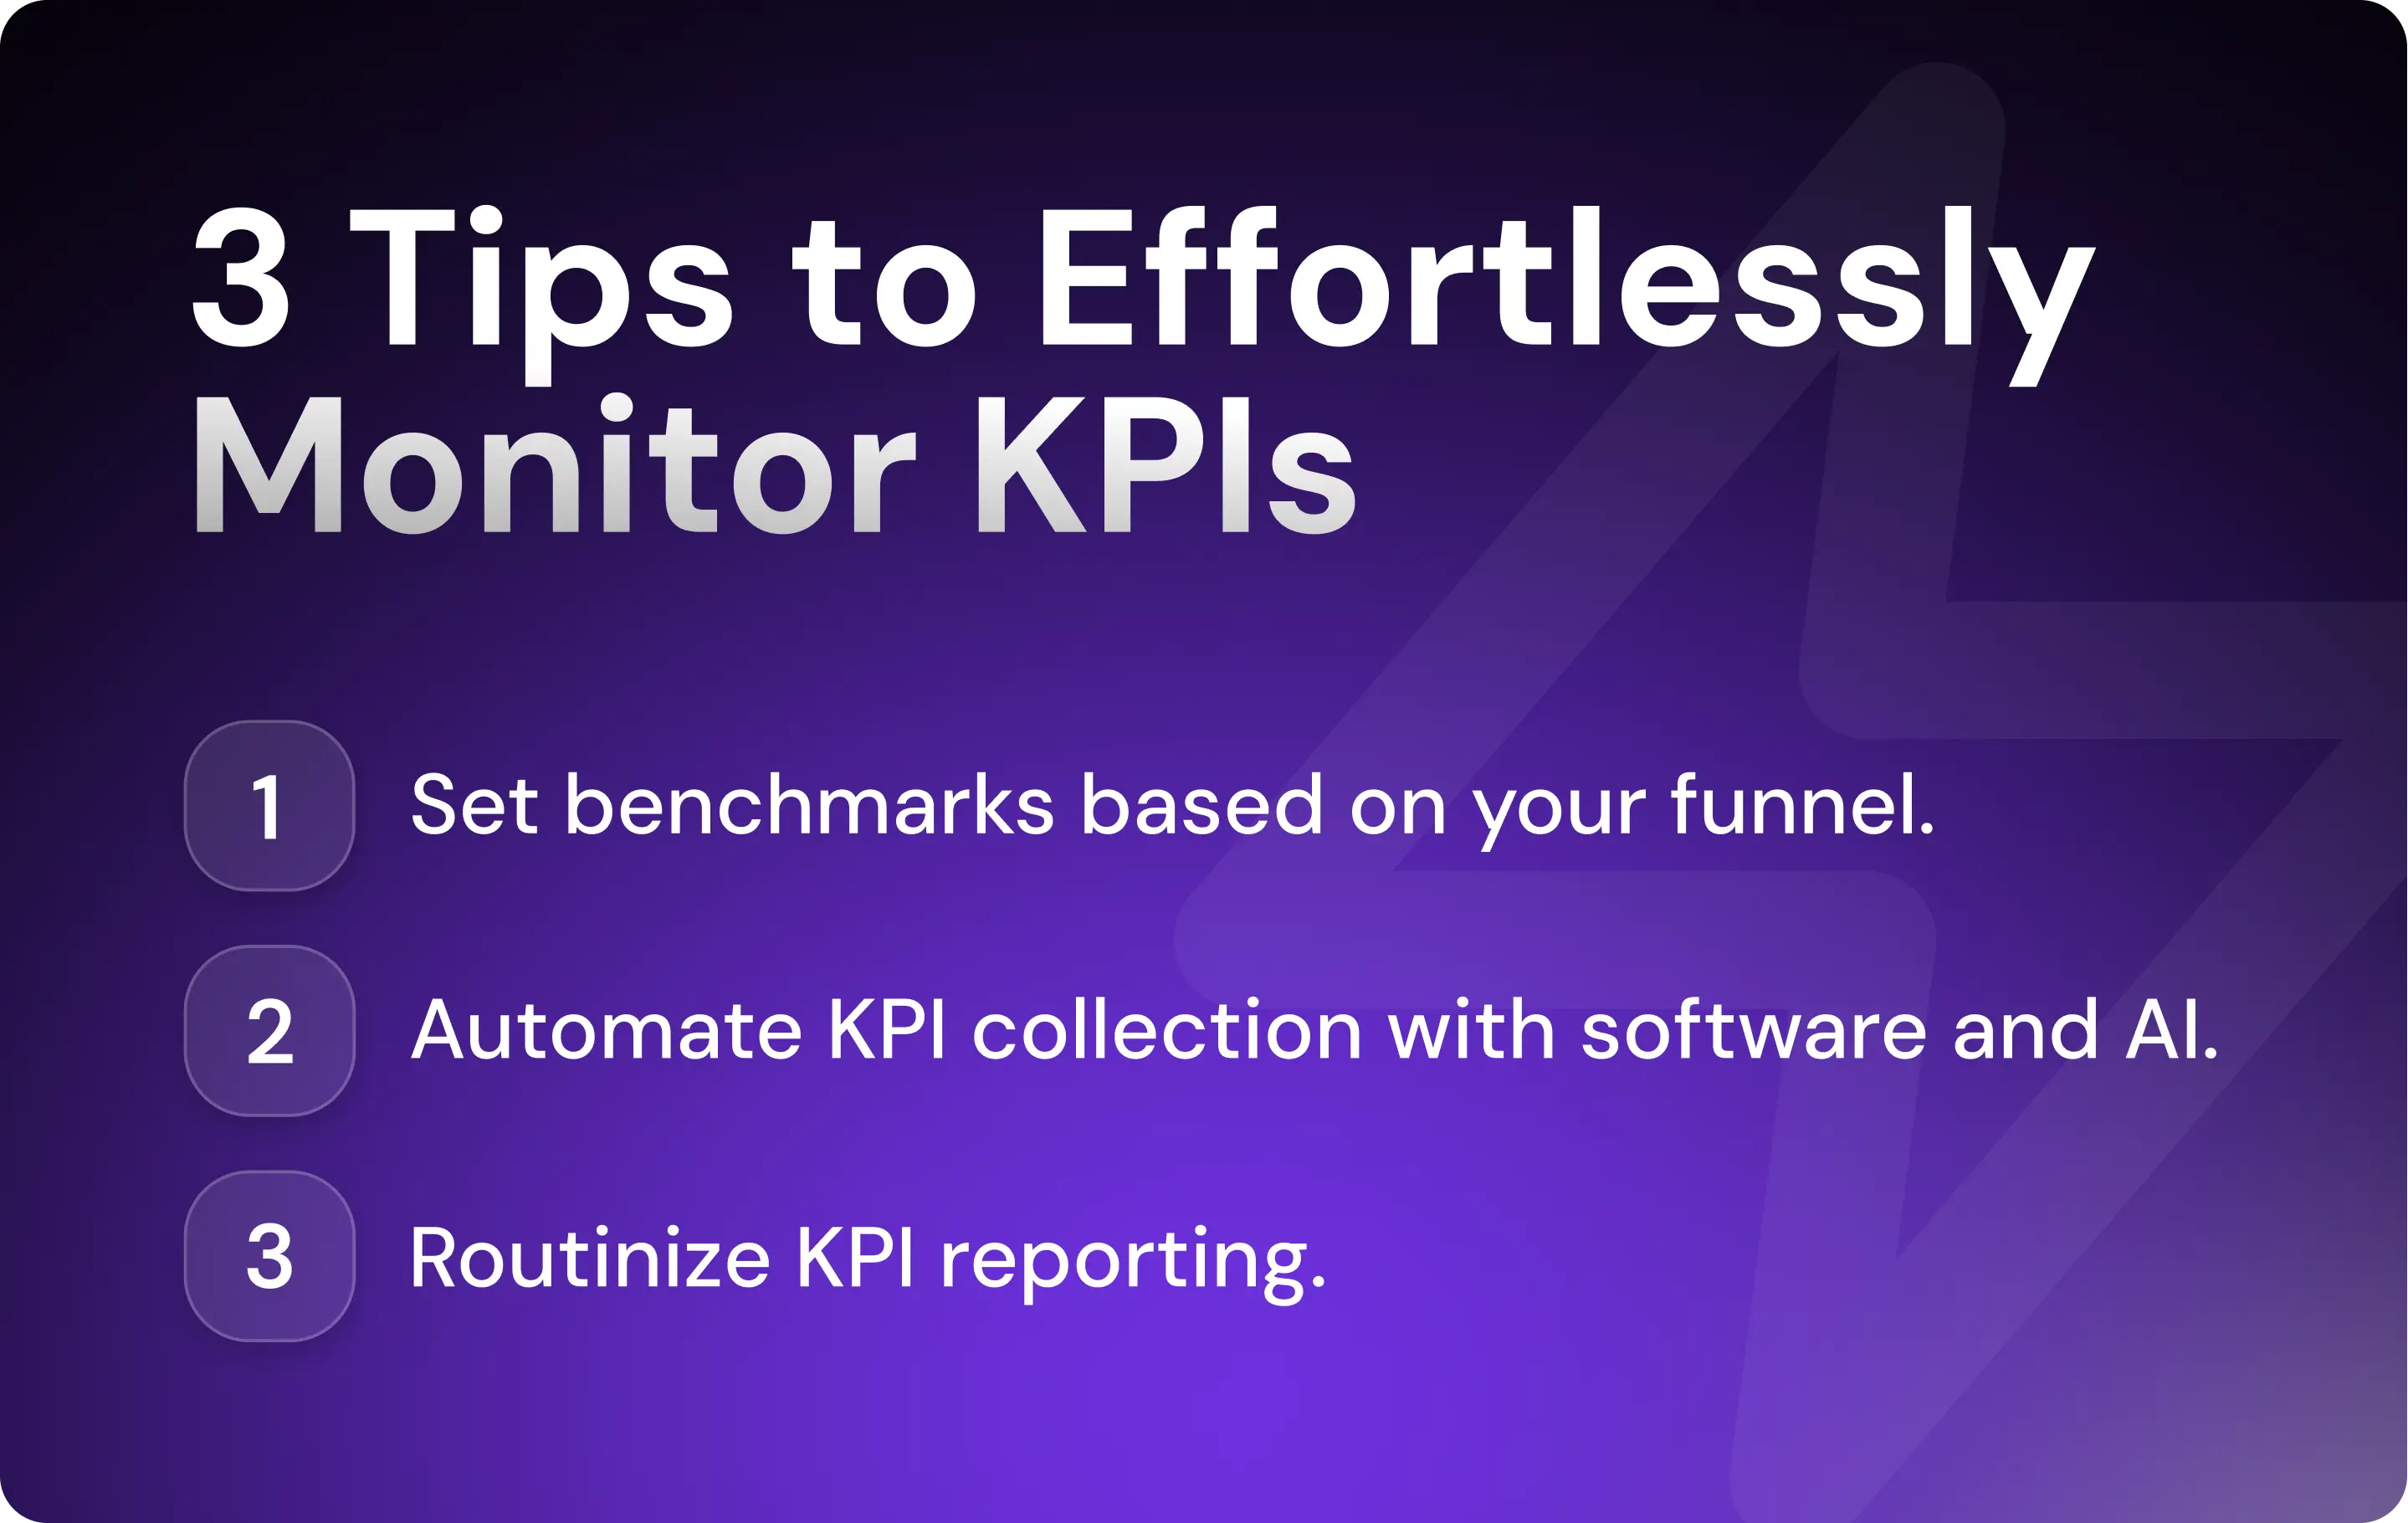
You don’t need to take a six-month hiatus from your sales career to study data analytics to track and use KPIs like a pro. A handful of well-chosen tactics and software will allow anyone, regardless of tech ability, to automate KPI collection, analysis, and reporting.
1. Set benchmarks based on your funnel
Establish lead gen KPI benchmarks based on your sales funnel, customer type, and industry. These are the numbers that you’ll strive to hit. When you fail to reach the benchmark, that KPI becomes a priority.
For example, if your benchmark for CAC is $500, but last quarter it was $700, that means you need to increase the efficiency of your customer acquisition strategy.
KPI benchmarks differ dramatically depending on your industry and customer type, so it’s important to create one that specifically relates to your business situation. Otherwise, you might be shooting for unrealistic benchmarks (or ones that are too easy).
Here are some example CAC benchmarks across different SaaS businesses:
Enterprise Agtech: $6,948
SMB Agtech: $612
Consumer eCommerce: $64
Middle Market eCommerce: $1,406
SMB Proptech: $518
Once you’ve identified benchmarks—using your own in-house data (ideal scenario) or good third-party sources—create a dashboard or weekly scorecard to track your KPIs. This ensures everyone is operating from the same performance intel.
2. Automate KPI collection and follow-up
Automate KPI collection with software that pulls data from various sources (CRM, marketing software, finance tools), analyzes it, and displays it neatly in custom or pre-built reports.
Handing KPI collection to technology reduces manual data entry, limits human error, and streamlines the reporting process.
Artisan, for example, provides comprehensive analytics data about the performance of your outbound campaigns—including engagement and response rates—in a single, centralized dashboard.

Report KPIs to the right stakeholders
One of the primary functions of KPIs is that they tell you what to work on.
They show you which lead generation projects to prioritize, which processes to tweak, and which campaigns to double down on—or moonlight.
For KPIs to function as catalysts for smart actions, you need to communicate them to the right stakeholders.
Here’s a basic framework for KPI reporting:
Weekly meeting: Discuss tactical KPIs like cold email reply rates, email deliverability score, speed-to-lead, and cold call conversations held. These help you track whether you’re doing the work necessary to achieve your sales goals.
Monthly meeting: Cover strategic KPIs like CAC, CPL, SQL-to-customer conversion rate, and the number of MQLs and SQLs generated. These help you make long-term decisions about your lead generation process.
Bonus: Benchmarks to know (even if you’re not there yet)
While there is a lot of variability in benchmarks across industries and target customers, it can help to have some starting benchmarks, which, over time, you can tweak to fit your funnel.
Here are six rough KPI benchmarks for the key outbound lead generation actions:
Cold email open rate: 30–40%
Cold email reply rate: 5–10%
Conversion rate: 10–15% (MQL to SQL)
CPL: Approx. $30–$100 depending on industry
LTV-to-CAC ratio: Aim for 3:1 or higher
SQL-to-deal: 20–30% is healthy
Meet and surpass your KPIs with AI automation
Lead generation KPIs help you spot areas for improvement in your outbound marketing and sales processes.
Want to lift all those KPIs with one quick and easy change? Consider automating outbound lead generation with an AI BDR.
Artisan, which is powered by AI BDR Ava, has helped countless companies generate more leads. Ava also minimizes CAC and CPL by automating all of the early and middle stages of outbound lead generation, freeing your reps to do the all-important work of closing deals.

Automate your outbound with an AI BDR
Meet Ava—your AI BDR who handles prospecting, outreach, and follow-ups, so your team can focus on closing.
Sam Rinko
SME @ Artisan
Sam Rinko is a former SaaS sales rep turned tech writer. He sold real estate software before writing about lead generation, cold calling, and AI sales tools.